What Is a Moving Average?
What Is a Moving Average?
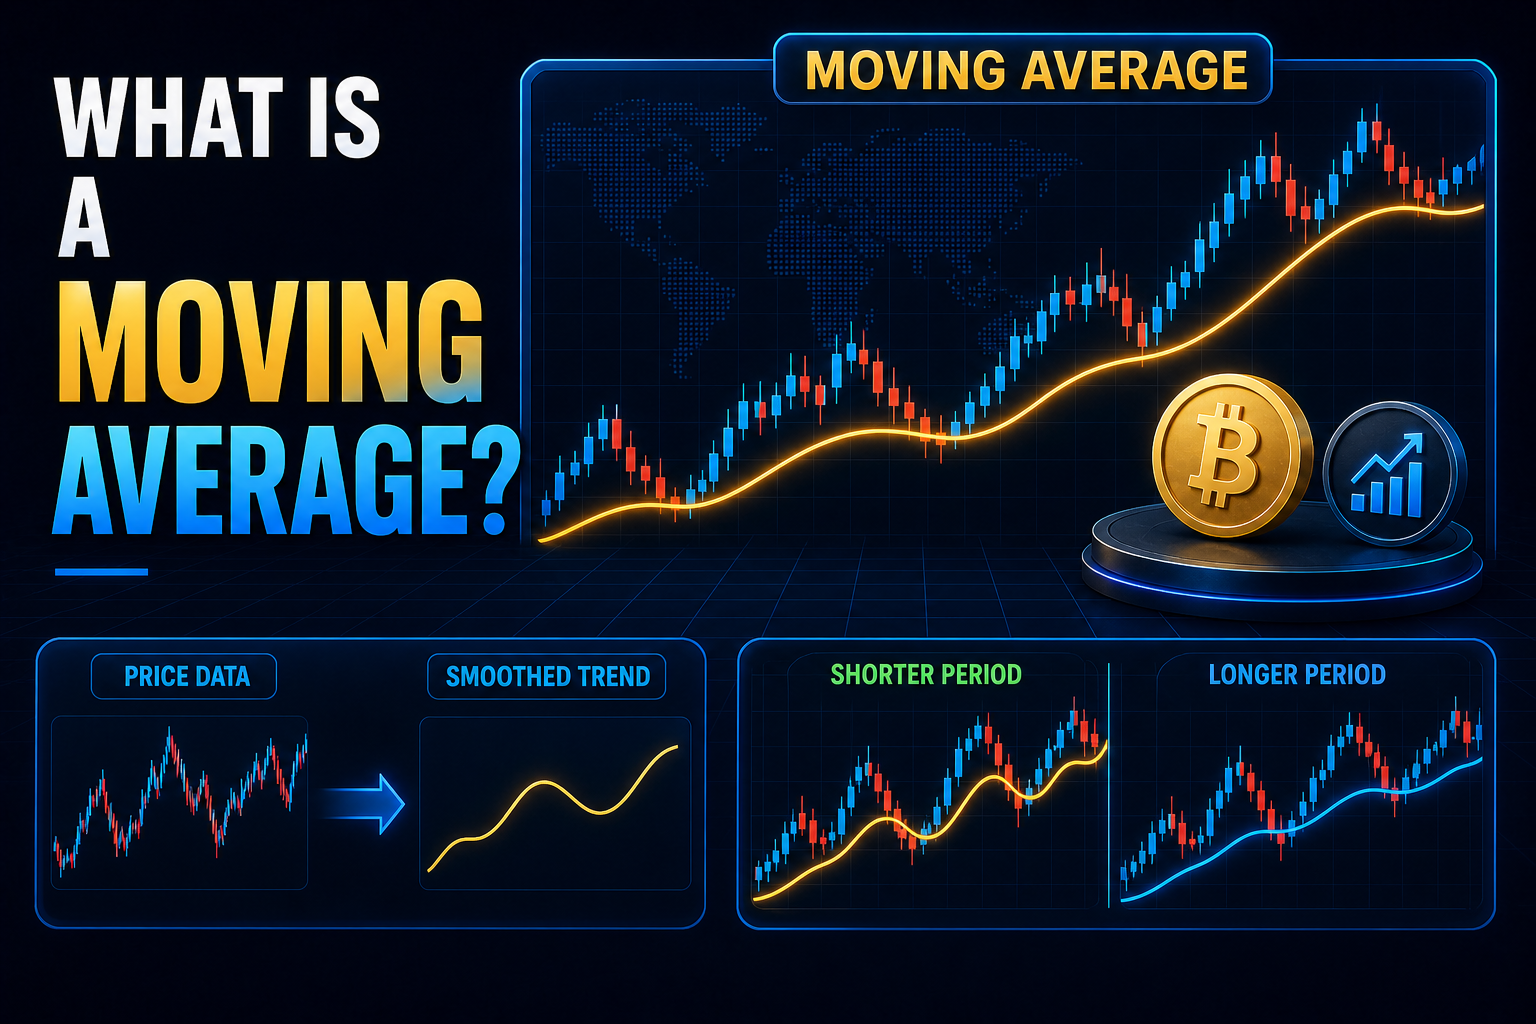
A moving average is a chart indicator that smooths price data over a chosen period of time. Traders use it to make the broader direction of a market easier to see when daily price movement is noisy.
Simple definition
A moving average is a line that shows the average price of an asset over a set number of periods.
As new price data is added and older data drops away, the average moves with the market. This is why it is called a moving average.
Why moving averages matter
Moving averages matter because price charts can be hard to read during volatile periods. A smoother line can help traders see whether price is generally moving higher, lower, or sideways.
They are not designed to predict the future. They are a way to summarize recent price behavior and provide market context.
How a moving average works
A 10-day moving average, for example, takes the average closing price from the last 10 days. Each new day updates the calculation, so the line gradually changes as the market changes.
Shorter moving averages follow price more closely. Longer moving averages change more slowly and can show the broader trend more clearly.
Common types of moving averages
A simple moving average gives each price in the chosen period the same weight. An exponential moving average gives more weight to recent prices, so it can react faster to new market movement.
Both are widely used. The choice depends on how quickly a trader wants the line to respond to changing prices.
How traders usually read them
Traders may compare price with a moving average. Price holding above a rising average can suggest that the recent trend has been stronger, while price holding below a falling average can suggest that recent momentum has been weaker.
Some traders also watch when shorter and longer moving averages cross. These observations are context tools, not certain trading signals.
Why moving averages matter in crypto
Crypto markets can be volatile, so moving averages are often used to make broader trend direction easier to see. Bitcoin and Ethereum moving averages can also provide context for how traders read overall market strength and risk appetite.
The same moving average can look different across timeframes, so traders usually consider the chart timeframe before interpreting it.
Moving averages are not standalone signals
A moving average can lag behind price because it is based on past data. It cannot guarantee that a trend will continue or reverse.
Moving averages are most useful when read alongside price structure, volume, support and resistance, volatility, and the wider market environment.
Example in a market update
If Bitcoin remains above a rising moving average, a market update may describe the recent trend as holding constructive momentum.
If Ethereum falls below a widely watched average, an update may say traders are watching whether the level becomes a source of resistance.
Common signals traders watch
- Whether price is above or below the average
- Whether the line is rising, falling, or flat
- Short-term and long-term averages
- Crosses between two moving averages
- Volume and market structure around the line
Key takeaway
A moving average smooths recent price data, helping traders see the broader market direction more clearly.
Comments (0)
Join the discussion
Sign in or create a free account to leave a comment.
No comments yet. Be the first to comment!